Creating your first Pinpoint+ is the most important step toward successful Standard Celeration Charting. Here's how to do it!
Steps
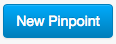
- Click "Pinpoints" and then the "New Pinpoint” button.
- Generate a Pinpoint+ by selecting a learning channel set and a movement cycle.
- Set Pinpoint Defaults, including your pinpoint goal, measurement type, chart type, and optional defaults like counting time, aims, and data display preferences.
- Assign your Pinpoint to a Category.
- Review your Pinpoint & Defaults.
NOTE: Pinpoints are created and stored in the pinpoint library for you organization and then are assigned to individual performers. Any defaults that you set when creating a pinpoint will be applied to the chart when the pinpoint is assigned to a performer. You can override some of the defaults later if needed.
In Depth
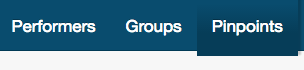
1. Getting there
From your Dashboard, click on Pinpoints.
Click on the blue box that says "New Pinpoint."
2. The Pinpoint+ Generator
The pinpoint+ generator (pinpoint plus a learning channel) on the left half of the screen walks you through creating a pinpoint+ (If you'd prefer to write in your own behavior target without using the Pinpoint+ generator, skip the next two steps). Start by selecting or typing a Learning Channel Set. This includes a Sensory In (how is the information taken in) and a Physical Out (what physical channel best describes the specific action or behavior of the performer).
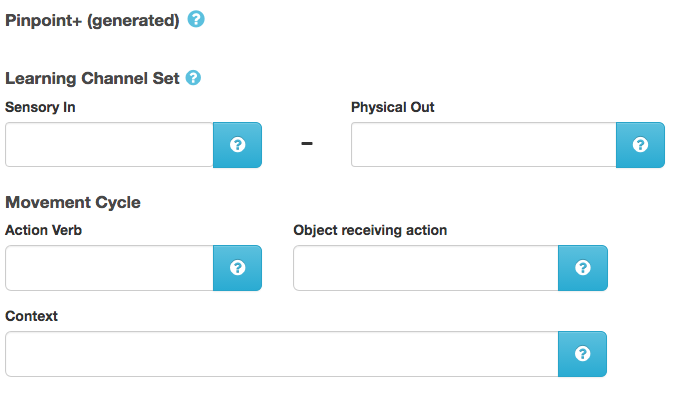
Next, enter a Movement Cycle. Type in a precise, observable, repeatable Action Verb in the first box. Add an "s" to the end of the action verb to make it present tense. In the second box, type the Object--a noun that occurs with, or receives, the action. Always make the object singular for counting purposes (ex: "Reads word" instead of "Reads words"). To complete your movement cycle, add a Context. This places the movement cycle in a setting that clarifies where the behavior occurs ("Reads word in list", or "Reads word in passage").
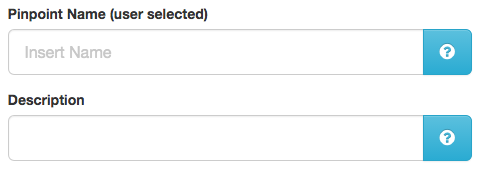
As you complete the pinpoint+ generator, the Pinpoint Name will be automatically populated.
If you'd rather write your own, go for it! Underneath the Pinpoint Name you will see another box that says "Description." Fill in that box with any additional, relevant information you want others to see or know about.
Once you are happy with your Pinpoint+, Click "Next".

3. Set Pinpoint Defaults
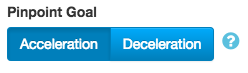
Click on the appropriate Pinpoint Goal. Once the pinpoint is created, this cannot be changed. If the behavior specified by your pinpoint+ is a behavior targeted for growth, then select Acceleration. Acceleration data will appear on the chart as a dot; and incorrect data will show up as an x. Select Deceleration if the pinpoint+ you created is a target for deceleration; these data will appear on the chart as an x.
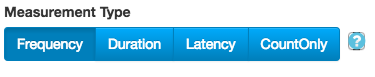
Select a Measurement Type to clarify how your data will be measured. Once the pinpoint is created, this cannot be changed. Frequency=count over time;Duration=the time it takes to complete a behavior; Latency=the time it takes to begin a task; or Count Only=actual counted values.
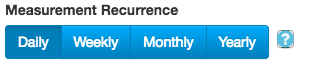
Then select a Measurement Recurrence to clarify how your data will be charted. Will the pinpoint be measured daily, weekly, monthly, or yearly?
Hint: if you'd like to see your data on multiple charts with our "roll-up" feature, then start by selecting the most granular chart of interest. You can roll up from a daily to a weekly or monthly, but cannot roll down.
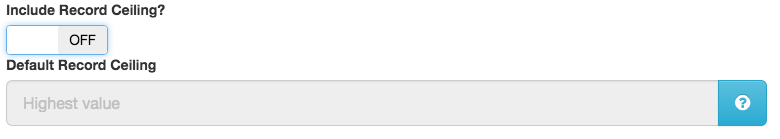
Next, if there is a constant ceiling imposed by the assessment somehow, enter the Record Ceiling here to remind you what results may not be possible.
Hint: Try to avoid record ceilings by providing unlimited opportunities to perform the behavior or by stopping the assessment time when all opportunities have been exhausted.
In this step, you will be asked to create Pinpoint Defaults. If you tend to have consistent counting times and aims across performers for this particular pinpoint+, then enter the defaults here. These defaults can be overridden if necessary. However, if you tend to have different counting procedures or aims between performers, you are welcome to skip the defaults.
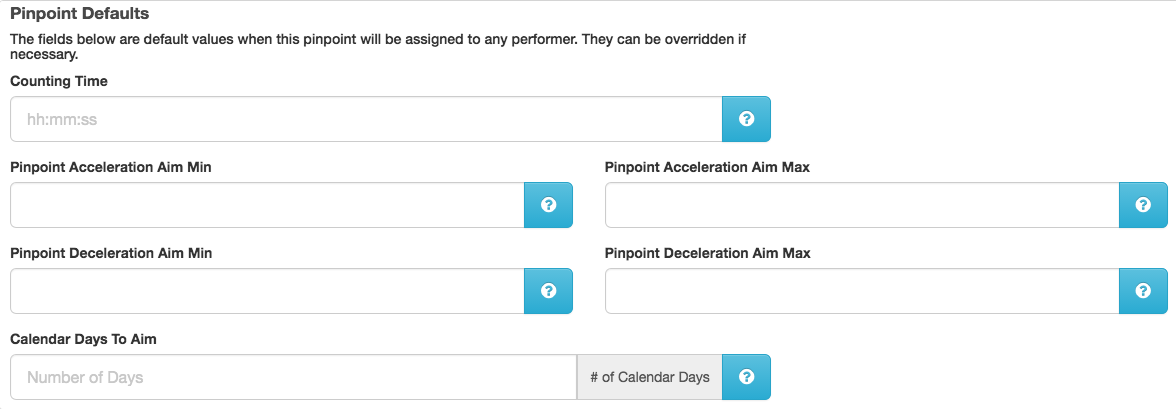
If you have chosen to measure frequency, then your first default to enter will be a Counting Time.
Now enter the Acceleration Aim, represented by a range from minimum to maximum. Hint: This should be calculated as a per-minute range of frequencies if you chose frequency as your measurement type.
Enter your Deceleration Aim, also represented by a range. If you chose a pinpoint+ targeted for Acceleration, you can still include a deceleration aim for your incorrect behaviors (aka "learning opportunities") in this field.
If you know about how many weeks it will take to reach aim, place your aim-star that many weeks from your starting date by selecting a number of Weeks to Aim.
Hint: Keep in mind that you can do this on a per-performer basis later, if you'd like. If you don't know when you should reach the aim, the aim-star will instead appear at the beginning of the chart and a yellow aim-bar will stretch across the chart.
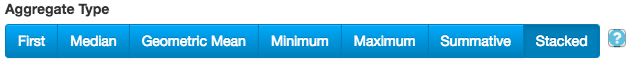
Next, select your Aggregate Type. This determines how recorded data will be displayed on the chart. Click "Next" when you've finished setting defaults.
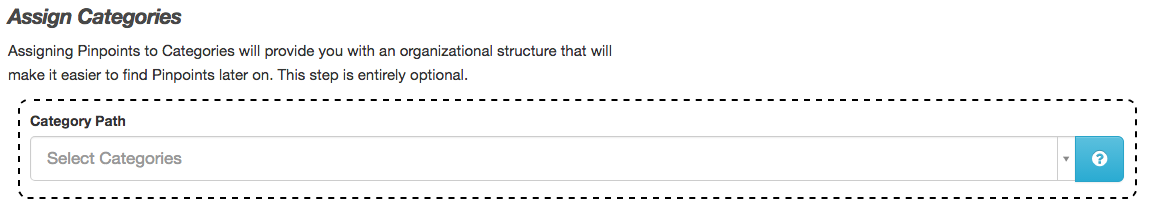
4. Assign a Category
If you have already created pinpoint categories, in this step you can select a category for this new pinpoint+. Don't worry, though -- you can easily create and assign categories for your pinpoints at another time.
5. Review & Complete
You've made it to the final step! Simply review the Description, Defaults, and Category for your new pinpoint+. If something isn't right, go back and change it now. If it's all good, click "Complete."

Congratulations! You've created your Pinpoint+. Welcome to the world of precision!
Ready to get to charting? Assign your pinpoint to a performer, then you can start adding data to a chart!
0 Comments